
By Preeti Shinde, Application Specialist, Hanna Equipments India Pvt. Ltd.
The holy river of Ganga is the largest river in India. The Ganges is threatened by severe pollution. This poses a danger not only to humans but also to animals; the Ganges is home to approximately 140 species of fish and 90 species of amphibians. The river also contains reptiles and mammals, including critically endangered species such as the gharial and South Asian river dolphin.
The Ganges River Dolphin can only be found in the fresh water rivers of Bangladesh, India and Nepal. These river dolphins are often known as the ‘Tiger of the Ganges’, since the river dolphin is an indicator animal, which has the same position in a river ecosystem as a tiger in a forest.
Due to extensive pollution in the Ganges River these Dolphins are getting extinct. The stretch of the Ganges river, also known as Hooghly in West Bengal, is roughly 500 km long and it passes through the densely populated Kolkata before merging with the Bay of Bengal in the Sundarbans, this is where the first community reserve for the mammal has been formed. The two main parameters that largely contribute towards the survival of dolphins is temperature and food. Thus, the conservation team, post treatment of the stretch of the river had to maintain several water quality parameters, such as the pH, the conductivity and DO of the river bodies so that the small fishes and the shrimps could also breed efficiently there.
What is water quality?
Water quality is a measure of water’s suitability to be used for a specific purpose, such as swimming, farming, or power generation. Water that is considered unsuitable for one application may be perfectly acceptable for another purpose. Quality is a statement of the physical, biological, and chemical characteristics of water based on key conditions. These conditions can vary by location, such as at different points in a river or by time depending on the climate. Surface water and ground water can also affect the quality of each other, since these two are connected at the water table. It is important to recognize that water quality can be adversely impacted by both natural and man-made factors. Regularly monitoring water sources can help identify potential issues before they cause serious harm.
There are a number of parameters that can be measured to indicate water quality. These parameters can be a measure of physical characteristics such as pH, conductivity, or temperature; a statement of the levels of various nutrients in water, such as nitrates and phosphates; or an indication of key elements and compounds in water, such as dissolved oxygen. Each parameter has some general standards and guidelines for determining if a tested sample should be considered acceptable or hazardous. The results of these tests are not necessarily absolute, since they must be compared in relation to what is considered normal levels for a body of water.
Aquatic organisms such as fish and plankton are cold-blooded, so the temperature of water has a direct impact on their body temperature. These organisms have ranges of temperature in which they can survive, or thrive. As the temperature reaches the high limit of its range for an organism, biological activity will be at a peak. This activity will decrease at the bottom of the range. If the temperature exceeds the acceptable range for an organism, the available supply of oxygen may be too low to sustain life. This is because warm water has an oxygen saturation point much lower than cold water. If temperature is below the acceptable range, not enough activity takes place to grow the species. High temperatures also contribute to the growth of algal blooms. Oxygen is consumed as these blooms are decomposed by bacteria, thus reducing the available dissolved oxygen supply.
Temperature in a water body varies based on the time of day and the amount of sunlight heating the surface of the water. Acceptable temperatures also vary depending on the type of river or stream being monitored. This depends on the watershed feeding the stream. If the stream is fed by a mountain spring, for example, the natural temperature of the stream may be quite cool (less than 68 degrees F). A stream that is considered warm water will have an average temperature greater than 68 degrees F but less than 89 degrees F. Temperature can also be influenced by the flow rate of a body of water. If the flow of water is increased, perhaps as a result of a heavy rainfall, the temperature can be expected to decrease. The increased current has a cooling effect on the temperature of the water.
High concentrations of TDS can lower water quality and cause water balance problems for individual organisms. On the other hand, low concentrations may limit the growth of aquatic life. Some of the effects discussed for the acidity and carbon dioxide parameters have relevance for EC, such as its negative impact on photosynthesis. This is because increased solids make water murkier, which slows down the rate of photosynthesis. EC provides an indication of total dissolved solids, of which total dissolved salts are a component. If the level of salts in TDS is high, this could also contribute to the acidity of the water. However, if the level of carbonates in TDS is high, this could contribute to an increase in alkalinity, which helps protect against acidity changes. This is a good example of the interrelationships between water quality parameters.
DO levels can help indicate the relative health of a water body. If DO levels are normal or high, the water is a good environment for a variety of aquatic life to flourish. If DO levels are low, it may indicate the presence of pollutants in the water. Some aquatic life can exist in water with a wide range of DO, but others cannot survive in a low DO environment.
DO measurements are expected to have large fluctuations if the water has significant plant life. This is due to the photosynthesis process. Since there is less photosynthetic activity at night, when light is not present, plants and animals in the water consume oxygen through respiration, but not as much oxygen is produced at the same time. As a result, DO levels in early morning are lower compared to other times of day. Once photosynthesis begins, DO levels will rise. This is a good example of the benefits of measuring parameters at various times throughout the day. If only a pre-dawn DO measurement is taken, an inaccurate conclusion may be drawn regarding the healthiness of the water.
While DO levels are partially influenced by photosynthetic activity, a large source of DO is from atmospheric oxygen mixing with water. This happens in larger amounts if the water is turbulent. The turbulence increases the surface area of the water, so atmospheric oxygen can mix with it more easily. Air has an oxygen concentration that is over 20 times higher than oxygen concentration in water. This concentration difference results in atmospheric oxygen dissolving in water when the two meet. If there is more water surface at this interface, then more oxygen from the air will be absorbed.
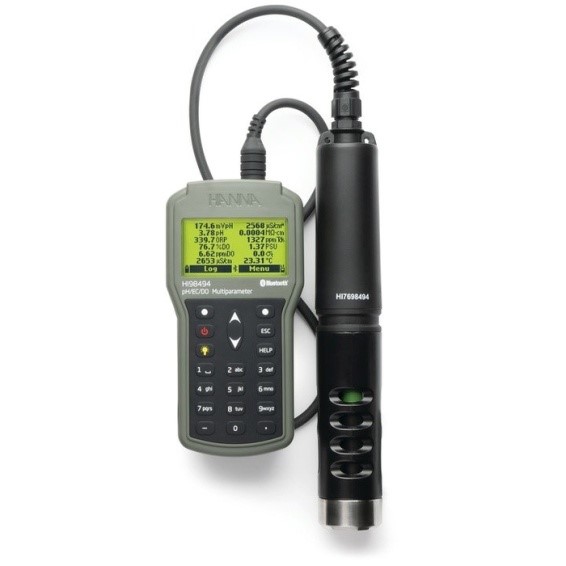
HI98494 is a meter Hanna can suffice such requirements. The new Multi-parameter pH/EC/DO Portable Meter includes Bluetooth® (HI98494) and optical DO technology. This new product combines Hanna’s rugged meter design with advanced digital sensors for testing up to 12 different water quality parameters, making it perfect for environmental testing. With the integrated Bluetooth® connection, users can easily transfer data to a smart device. Hanna’s portable meter (HI98494) is stored in a convenient carrying case and is always prepared for successful testing.
The meter offers easy Sensor replacements which are quick and easy with field replaceable, screw type connectors and are color-coded for easy identification. Tougher by design, this portable meter is waterproof, IP67-rated and can withstand immersion in water of 1m for up to 30 minutes. The meter connects to the multi-parameter probe through a single waterproof connector and makes attaching and removing the probe quick and easy. The meter automatically detects the probe when connected. The meter connects wirelessly via Bluetooth to a smart device with the Hanna Lab App.Bluetooth® 5.0 Connectivity of HI98494 offers the ability to connect wirelessly to a smart device running the Hanna Lap App. Using the app, log lots canbe e-mailed or downloaded for review.
Sensor replacement is quick and easy with field replaceable, screw type connectors and are color coded for easy identification. These meters automatically recognize sensors. The optical dissolved oxygen sensor uses a smart cap that has an RFID tag that stores calibration coefficients unique to each cap. The RFID keeps track of the age of the cap and alerts the user when it should be replaced.
HI98494 can be used to log one data point or do interval logging for continuous logging at a specified interval. All logs have the option to store data into a named lot and the ability to add remarks. Both help to provide for meaningful data including notes on local environmental conditions.
About the Author
Ms. Preeti Shinde is an Application Specialist with Hanna Equipments India Pvt. Ltd. She has been with Hanna for more than 4years. She supports Pan India technical issues and queries. Preeti Shinde’s hobbies are sketching and traveling. To know more about the contributor of this article , you can write to us.