
Research Scholar, Department of Civil Engineering, C.V. Raman Global Uni-versity (C.V.R.G.U), Bhubaneswar, Odisha, India.
Email: das.abhijeetlaltu1999@gmail.com
Abstract. Water is the furthermost significant component in the terrestrial foundation and regulating the climate. It is one of the chemicals that affects life the most significantly.Typically, the characteristics of water’s physical, biological, chemical, and constitution are utilised to define it. Groundwater resources are being depleted and are becoming significantly and diversely contaminated as a result of rapid economic development and the unrestrained use of chemical pesticides and fertilisers in agriculture.In-place sewage systems, landfill leachate, wastewater treatment plant effluent, leaking sewers, hydraulic fracturing, gas stations, or excessive fertiliser use in agriculture are the usual causes of ground water adulteration. Pollution can also be brought on by natural contaminants like fluoride and arsenic.Use of tainted groundwater exposes the entire public to illness or injury.Poor water quality can lead to a range of negative effects, including subpar goods, low earnings and serious risks to human health.This document provides detailed information on underground water quality characteristics, including pH, temperature, biological oxygen demand,dissolved oxygen, alkalinity, chemical oxygen demand, nitrite, hardness, ammonia, nitrate, sulphate and phosphate.
Keywords: Water Quality Index (WQI), Dissolved Oxygen (D.O.), Biochemical Oxygen Demand (BOD), Alkalinity, Eutrophication, Heavy metal.
- Introduction
The lack of access to clean water is a global issue that affects all countries. The strong human desire to improve living standards has inevitably resulted in water pollution, with cumulative efforts and activities establishing as heavy industrial development and incessant urbanization, leading to progressive pollution of aquatic system [1-4]. When it comes to drinking, irrigation of crops, waste disposal, transportation, recreation, irrigation of crops, and industrial production, humans are utterly dependent on renewable resources of freshwater. The quality and quantity of water that can be used to placate human necessities are already threatened in many parts of the biosphere due to rising water usage, growing population, climate change and a rising water usage, the gap between freshwater availability and demand will worsen over the next century. About 80% contamination of Indian water resources, according to estimates by WHO, is caused by inhabited refuse. Water system management issues could have a substantial impact on the supply of drinking water [5-6]. Industrial waste is the main basis of water contamination. When wastewater from various industries is disposed of in the water without being properly treated [2].Water’s biological, physical and chemical properties have been changed in such a way that they are no longer useful for the intended application [7].
A change in the underlying sediments’ and aquifer’s’ chemical make-up also affects the variation in water quality. Surface sources like canals, lakes, dams, and rivers provide around one-third of the world’s drinking water needs. Water is used in some way or another by an organism’s chemical and physiological processes. In numerous aspects of existence, water is crucial. In order to research numerous physicochemical water characteristics including B.O.D. (biochemical oxygen demand), WQI (water quality index), D.O0 (dissolved oxygen), Eutrophication, heavy metal, alkalinity, etc., water samples from rivers and lakes provide an appropriate platform. Many scientists have occasionally studied the physicochemical properties of water bodies. The physicochemical features will also aid in the continuation of eco-biological impact research, the detection of pollution sources and the beginning of remedial action procedures for polluted water bodies [8–10]. Numerous scholars in India have studied the physicochemical and biological properties of reservoirs and rivers. Since a variety of physical and chemical elements can combine to affect primary production levels, which in turn affect total biomass and trophy structure across the aquatic food web, water quality must be taken into account when evaluating wetland habitat.
In the current review work, certain parameters for evaluating the quality of water have been presented together with earlier research on the subject by academics and scientists.
- Analysis of Water Quality
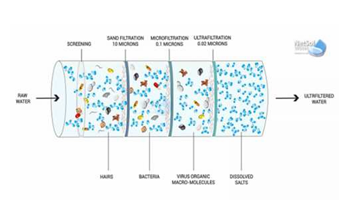
Before using water for drinking, residential, industrial or agricultural purposes, it must first be tested. Different biological, physical and chemical factors must be used to test water. The only factors considered when selecting water testing parameters are the envisioned use of the water and the level to which its purity and quality are required. [11-14]. Different kinds of microbiological, dissolving, suspended, floating, and bacteriological pollutants are present in water. Physical tests should be conducted to evaluate the substance’s odor, colour, temperature, pH, TDS, turbidity and further physical characteristics. Chemical tests should be conducted to evaluate the substance’s COD, BOD, alkalinity, hardness, DO and other characteristics [15]. Water must be verified for heavy metal trace, organic and metal contaminants like pesticide scum in order to obtain more and more pure, high-quality water. It goes without saying that potable water must satisfy all of the required parameters during tests and contain the necessary amount of minerals [16-17]. Only in wealthy nations are all these requirements properly checked because there are very few organic and heavy metal pesticide contaminants in water, necessitating extremely analytical equipment and skilled labor. To monitor the water quality, a variety of physical-chemical parameters must be used.
- Temperature Measurement
Using a digital thermometer, the temperature is determined by dipping the thermometer in the sample and recording the result [18]. Temperature is the degree of heat or cold in an aquatic organism’s body, whether it is in water or on land. Despite having cold blood, fish experience body temperature changes in response to their environment. These changes have an impact on the fish’s physiology and metabolism as well as its production. The micro biota’s rate of metabolic activity as well as their rate of respiration both increase with temperature because of the rise in oxygen demand. It also results in increased ammonia levels in water and decreased oxygen solubility. However, with prolonged ice cover, chemicals such as carbon dioxide, methane and hydrogen sulfide can build up to dangerous levels and affect the health of fish.
Fig. 1. Global map of temperature of shallow groundwater and land surface (GWT). LST is calculated using the daily MODIS products MOD11A1 and MYD11A1 averaged over a 10-year period (01/2005–12/2014). With regard to seasonal fluctuations in cloud cover, the bias in favor of cloud-free days was rectified. The same time frame saw the collection of (multi)annual mean GWTs at depths of up to 60 m
Fig. 2. Relationship between (a) and temperature of land surface (LST) and groundwater temperature (GWT) and (b) estimated and measured GWT. The equality line is shown in dark grey
- pH Measurement
The pH of water is a significant factor in determining its acceptability for a variety of uses, bathing, cooking, including drinking, agriculture and washing, among others. According to the BIS, water’s pH should not overlie on either side of range 6.50-8.50. With a pH of 7, pure water is considered to be neutral. Acidic water is that which has a pH below 7.0, and basic or alkaline water is that which has a pH over 7.0
- DO Measurement
Determining the amount of dissolved oxygen in a river is crucial since aquatic life there depends on it and needs at least 4ppm of DO to survive [8, 18, 21]. DO tests are carried out to confirm this. The Digital Dissolve Oxygen Meter is used to measure the DO test at the location of the sample collection. When measuring DO on-site, the results are correct, but if DO is measured later, the results will alter due to changes in the atmosphere and temperature
- BOD Measurement
The BOD is a measurement of how much total dissolved oxygen is used by microorganisms during the biodegradation of organic materials, such as sewage or food particles. Rural ponds may have an excessive amount of phosphate, cow waste, and domestic sewage from non-point sources, which all contribute to a high organic load and a higher BOD level
- COD Measurement
Chemical oxygen demand, which is typically combined with biological oxygen demand, is a measure of the amount of organics in water (BOD). The COD is a measurement of the amount of organic matter in a sample that can be oxidized by a potent chemical oxidant. . The COD is frequently employed as a gauge of the organic and inorganic materials’ susceptibility to oxidation in water bodies, industrial plant effluents and sewage discharges . As a result, the COD is an accurate indicator for determining the degree of water pollution . As organic and inorganic matter concentrations rise, so does the COD of water . According to Garg , the COD concentration in Ramsagar reservoir ranged from 3.600 to 17.400 mg/l.
Fig. 3. Distribution of the stage of population of sprat in the two possible community conditions that give birth to the COD Allee effect. Right: Staffing to big size classes of sprat is strong with the presence of COD and high predation, especially on minor sprat, as a result of decreased intra-specific competition. Left: In absence of COD and low predation, individuals amass in the trivial-adult stage (stunted population). As a result, the remaining sprats grow quickly and produce a lot of progenies (arrows), which (mainly young) cod can eat. Even though cod target all sprat size classes, only the flow of biomass illustrating predation on young sprat is depicted because this interaction is what ultimately results in the other community states
- Carbon-di-Oxide Measurement
Unrestricted carbon dioxide, an exceedingly soluble gas in water generated by animal respiration, serves as nature’s primary source of carbon. It can exist in water as dissolved or bound bicarbonate or carbonates in coral reef habitats, the earth’s crust, and limestone. The pH of any system, especially those with inadequate buffering, is reduced when carbon dioxide is dissolved in water. This pH decrease can be harmful to aquatic life
- Alkalinity Measurement
Alkalinity, a measurement of the inclusive concentration of bases in pond water that includes dissolved calcium, magnesium, and other compounds as well as, bicarbonates, hydroxides, borates, phosphates, and carbonates, is the volume of water to engross variations in pH. Alkalinity is primarily increased by lime leaching from cement ponds or calcareous rocks, photosynthesis, sulfate reduction, and de-nitrification and it is primarily decreased or consumed by sulfide, respiration, and nitrification , as well as to a lesser extent by evaporation and decomposing organic matter. However, in case of insufficient alkalinity, even minor bit of acid might source a large pH change.
- Nitrite-N (NO2-N) Measurement
An intermediate in the transformation of NH4+ or NH3 into NO3, nitrite, that is a by-product of oxidized NH3 or NH4+. Nitrification, which is carried out by the system’s naturally occurring highly chemo-autotrophic bacteria, aerobic, gram-negative, completes this process. Due to the rapid nature of the dialogue, large nitrite amounts are not frequently seen. The “brown blood illness” is a condition where high amounts of the substance do, however, result in hypoxia brought on by the hemoglobin in fish blood becoming inactive [34]. Boyd [35] asserts that less than 0.3 mg/l of nitrite is the ideal level for aquaculture. The concentration of nitrite at cage stations was greater than the standard permitted value due to the influence from fish waste and more feed, according to research [36–42] that found the concentration of nitrite-N lied in the range of 0.001-0.28 mg/l in cage culture systems. It has been discovered that a higher less dissolved oxygen, more ammonia and pH can make it more poisonous.
- Nitrate-N (NO3-N) Determination
Nitrate is created via the process of nitrification, which is the oxidation of NO2 to NO3 by aerobic bacteria. De-nitrification of nitrate that aquatic plants cannot directly absorb occurs in anaerobic sediments . According to Boyd , the ideal nitrate content for aquaculture is between 0.2 to 10 mg/l. Sewage and other pollutants high in nitrates can also contaminate surface water. Drinking water with higher nitrate content is harmful . The Environmental Protection Agency (EPA) has determined that 10.00 mg/l of nitrate is the maximum contamination level (MCL) for water to be used for drinking purpose . The concentration of nitrate in receiving waters is significantly impacted by runoff from farming operations and waste disposal sites. The usage of fertilizers on farms may have contributed to receiving streams’ elevated nitrate levels through leaching and surface runoff during heavy rains.
- Ammonia (NH3) Determination
Ammonia is a consequence of the protein metabolism that fish harvest, as well as the breakdown of bacterial of biological waste like dead planktons, food scraps and manure. Both ionized or unionized and ammonia are referred to as “total ammonia,” yet only the unionized form (NH3) is extremely toxic .
- TSS Measurement
Total suspended solids, also known as non-filterable solids, are those solids that are retained by a filter with 1-micron holes. By running a known volume of sewage sample through a glass fiber filter equipment and weighing the dry residue that remains, their amount may be calculated .
- Total Dissolved Solids (TDS) Measurement
Total dissolved solids, also known as filterable solids, are those solids that are not retained by a filter with 1-micron holes. By running a known amount of sewage sample through a glass fibre filter equipment and weighing the dry residue that remains after boiling the filtrate sewage, their quantity may be calculated.
- Measurement of Turbidity
As soon as you can after the sample is taken, determine the turbidity. Before examination, gently stir all samples to achieve a representative measurement. If sample preservation is not possible, start the analysis right away. If storage is necessary, refrigerate or cool to 4°C to reduce the amount of microbial degradation of solids. For the best outcomes, test the turbidity right away without changing the pH or temperature of the original sample. A digital turbidity meter is used to measure turbidity. This was calibrated using a standard NTU .
- Heavy Metals Measurement
Each sample of acid-digested water weighed 100 cm3 and was placed in a beaker. The beaker was then placed in a 70°C oven to condense the water to 50 cm3. Using an atomic absorption spectrometer, the concentrations of Co, Cu, Cr, CD, Zn, PB and Ni in each sample of water were measured (AAS: AAS: LABINDIA: AA- 7000) Prior to analysis, AAS required phase of acid digestion, which was accomplished by exposing the samples to concentrated HNO3 [29]. Samples are digested using the methods endorsed by the American Public Health Association (APHA). The suggestions in the instruction manual were used to determine the instrument settings (IO).
- Index of Water Quality (WQI) Measurement
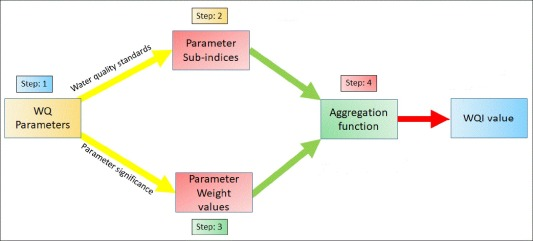
The WQI is premeditated in three steps. Each criterion was given a weight (Wi) in the first phase based on its relative significance to the overall quality of water intended for consumption. Nitrate has been given a maximum weight of 5 due to its significant role in determining the water quality . The relative weight is computed using Eq. 1 in the second step.
Where n is the number of parameters, relative weight is denoted by Wi and wi represents the weight of each parameter. The parameter’s calculated Wi values are provided in Table 1.
In the third stage, by dividing each parameter’s concentration in each water sample by the relevant standard, according to the BIS specifications, and multiplying the result by 100, a quality rating scale (qi) is obtained for each parameter (Eq.2)
Where Si is the BIS-recommended standard for Indian drinking water in mg/l for each chemical parameter and Ci is the concentration of each chemical parameter in every single water sample in mg/l. The parameter’s optimal value in clear water is Cio. With pH, qi is equal to (Ci – 7)/(Si – 7)100 and Cio is equal to 7. For the remaining parameters, the optimal value is 0.
Table 1. Chemical parameters and their relative weight
| Chemical indicators | Weight | Indian Standard | Relative weight (Wi) |
| Magnesium | 2.00 | 30.00 | 0.091 |
| Total hardness | 2.00 | 300.00 | 0.091 |
| Calcium | 2.00 | 75.00 | 0.091 |
| TDS | 4.00 | 500.00 | 0.182 |
| Chloride | 3.00 | 250.00 | 0.136 |
| pH | 4.00 | 6.50-8.50 | 0.182 |
| Nitrate | 5.00 | 45.00 | 0.227 |
Each parameter’s sub index (SI), which is utilized to calculate the WQI in accordance with Equations 3 and 4, is first determined in order to calculate the WQI.
The ith parameter’s subindex is SIi. The estimated WQI values are classified into five categories in Table 2.
Table 2. Classification of water quality based on WQI value.
| Water Quality Index | Quality of Water |
| >300.00 | Unsuitable |
| 200.00-300.00 | Very poor |
| 100.00-200.00 | Poor |
| 50.00-100.00 | Good |
| <50.00 | Excellent |
The five categories range from “good water” to ” unfit for drinking water”, according to the computed WQI values (Table 2). The WQI has an inter-seasonal range of 28 to 267, with 24% of water-bodies rated outstanding in the pre- and post-monsoon seasons and 18% rated excellent during the monsoon season. Approximately 62%, 58% and 60% of water bodies are in good quality during the monsoon, pre-monsoon and post-monsoon seasons, respectively in pre-monsoon, monsoon and post-monsoon seasons, respectively. 14%, 16% and 12% of water bodies were found to be poor water bodies in the respective seasons. The remaining 6%, 2% and 4% of water bodies were very poor water bodies in aforesaid seasons. 16% and 48% of water bodies are in excellent and good water bodies throughout the monsoon and post-monsoon seasons. Limits for the physicochemical properties of lake water in India are shown in Table 3.
Table 3. Physical and chemical features of Indian lake water
| Sr. | Parameter | BIS Specification |
| 1 | PH | 6.50-8.50 |
| 2 | Color | 5 Hazena max |
| 3 | Appearance | Clear |
| 4 | Turbidity | 5 NTU max |
| 5 | Alkalinity | 200 mg/L max |
| 6 | EC | lacking mention |
| 7 | Chloride | 250 mg/L max |
| 8 | Florid | 1 mg/L max |
| 9 | Sulfate | 200 mg/L max |
| 10 | Phosphate | lacking mention |
| 11 | Ca H | 75 mg/L max |
| 12 | T H | 300 mg/L max |
| 13 | TDS | 500 mg/L max |
| 14 | Mg H | 30 mg/L |
| 15 | FRC | 0.25 mg/L |
| 16 | Silica | lacking mention |
| 17 | COD | lacking mention |
| 18 | Hydrazine | lacking mention |
| 19 | DO | lacking mention |
| 20 | BOD | lacking mention |
| 21 | NO3 | 50 g/L |
| 22 | SO3 | lacking mention |
- Physicochemical Review of Some Water Samples from India
The study of physical-chemical parameters is crucial to obtaining a precise understanding of the water quality, and it allows us to compare the results of various chemical and physical parameter values with reference values (Table 3). Here is a brief summary of some previous research studies. Pulp and paper sector effluents are one of India’s most polluting industries, according to Tripathi . Small and large pulp and paper mills use several procedures that produce effluents with drastically varying physical-chemical characteristics due to their disparate production capacities and raw material sources. To diminish the impact of various pollutants on the environment, before being released into the drainage channel, such contaminated effluents must undergo sufficient treatment. Based on the findings presented here, it can be stated that the effluent emitted from both paper industries is extremely contaminated and exceeds the limits set by Indian regulatory agency norms. Furthermore, it is claimed that the pollutants produced at various stages of the paper manufacturing process can be reduced either by replacement of some current bleaching and pulping techniques with ECF (Elemental Chlorine Free bleaching), bio-pulping, TCF (Total Chlorine Free bleaching), bio-bleaching, and ozone bleaching, or by treating the effluent with physical, biological or chemical methods. This monitoring research of pulp and paper mill effluent collected from wood-based and agro-based sources resulted in the creation of a data bank that may be used to successfully anticipate their toxicity and implement appropriate management. Agarwal’s research shows that the water in the Bihar River can perform as a good habitat, provides educational data, and aids in understanding water features. The pH value suggests that the alkaline water in May have resulted from the high temperature, which suggests that CO2 is soluble in the water. The Bihar River’s Baba Ghat’s water quality metrics, including alkalinity, total hardness, chloride ion, pH, BOD, COD are all well within the acceptable range, according to the analysis. Consequently, appropriate methods should be developed. According to research by Vyas , the majority of fresh water bodies worldwide are becoming contaminated by human waste, industrial waste, sewage, , agricultural waste, and religious practices like idol immersion. The Central Pollution Control Board has created a thorough set of regulations regarding the act of immersing idols in oceans, lakes and rivers (Guidelines for Idol Immersion, CPCB, 2006). These regulations outline and define the function of state pollution control boards in evaluating the water quality of aquatic bodies and categorizing them according to specific physiochemical parameters. If these recommendations are followed and put into practices, the quality of the river’s water after idol immersion could significantly improve. Tamot asserts that the most crucial metric for determining the water quality is DO, which was discovered to be Nil at seven places despite being necessary for all aquatic creatures’ metabolism. Ganai and Parveen [56] came to the conclusion that water temperature and water chemistry are the primary influences on phytoplankton dispersal, chloride, transparency, dissolved oxygen, alkalinity, TDS and CO2. Hardness and Conductivity, on the other hand, have less of an impact on the distribution of phytoplankton groups. Rani Lake water displays low high COD, BOD, DO, hardness, turbidity, alkalinity, chloride, TDS, nitrate and phosphate during 2008 and 2009, according to Mishra [57]. These parameters’ values were discovered to be over the allowable limit (IS: 10500). A higher pH number implies that the water is slightly alkaline. The results unambiguously show that sewage discharge and other anthropogenic activities have caused this lake to become contaminated and entropic in character. The amount of oxygen utilized during aerobic processes of organic material degradation brought on by microorganisms is measured by biological oxygen demand. Therefore, the BOD provides details on the proportion of an organic substance in a sample of water that can be converted biologically. As a result, it is necessary to take into account how susceptible certain materials are to oxygen oxidation. The pre- during, and post-immersion activities yielded the ranges of 1.4-35, 4-55, and 3.3-38 mg/L. At Site-7, the immersion period produced the highest BOD value (Majnu Ka Tila). Analysis was also done on the COD, which is frequently used to estimate indirectly how many organic chemicals are present in water. COD is a helpful indicator of water quality because the majority of its applications estimate the volume of organic contaminants present in wastewater or surface water (such as lakes and rivers). As indicated by a number of researchers [58-61], the value of COD in conjugation with BOD is beneficial in determining the hazardous circumstances and existence of physiologically resistant organic compounds.
- Conclusions and Recommendations
The water quality of rivers and lakes has declined as a result of all the aforementioned effects. It provides a hint for municipal authorities to create effective management plans. The main factors influencing temperature variation are atmospheric temperature and weather. The industrial effluents that were released may have contributed to the pH decrease in Indian water bodies. This outcome is consistent with prior scientists’ reports. The decrease in water volume due to rapid evaporation at high temperatures, high loadings of organic compounds, chlorides, detergent and other pollutants are all responsible for the increase in hardness. Low levels of DO as a result of wastewater discharge from enterprises that were discharging some biological wastes that demanded a lot of oxygen. An important factor that is frequently used to estimate the pollutant load of waste water is biological oxygen demand. The purpose of the BOD test is to quantify the quantity of carbonaceous matter that is biochemically oxidized. Values of BOD were caused by a faster rate of organic matter decomposition with turbidity, at a higher temperature and slower water current. A test called chemical oxygen demand is used to gauge how polluting household and industrial waste. This provides important information regarding the possibility for pollution from home sewage and industrial effluents. Many aquatic zones in India have high COD value, which shows that industrial effluents released by industrial units are mostly to blame for the pollution there. Therefore, it is crucial to check the water’s purity using the several criteria listed above before utilizing it.
- References
- Shukla, B. K., Bhowmik, A. R., Raj, R. B., and Sharma, P. K.: Physico-chemical parameters and status of ground water pollution in Jalandhar-Phagwara region. Journal of Green Engineering, 9(2), 212-223 (2019).
- Shenoy, A., Shukla, B. K., and Bansal, V.: Sustainable design of textile industry effluent treatment plant with constructed wetland. Materials Today: Proceedings, 61(02), 537-542 (2022).
- Shenoy, A., Bansal, V., and Shukla, B. K.: Treatability of effluent from small scale dye shop using water hyacinth. Materials Today: Proceedings, 61(02), 579-586 (2022).
- Shukla, B. K., Bashir, M., and Sharma, P. K.: An Analytical Investigation of Surface Water Quality and Pollution Status in Srinagar, Jammu and Kashmir, India. Journal of Green Engineering, 11, 952-962 (2021).
- Madhuri, T. U., and Subhashini, B.: A Study on Groundwater Quality in Residential Colonies of Visakhapatnam. Ecobiology of Polluted Waters, 102 (2006).
- Shukla, B. K., Gupta, A., Sharma, P. K., Bhowmik, A. R.: Pollution status and water quality assessment in pre-monsoon season: A case study of rural villages in Allahabad district, Uttar Pradesh, India. Materials Today: Proceedings, 32, 824-830 (2020).
- Periyasamy, S., and Temesgen, T.: Application of Biochar for Wastewater Treatment. In Biochar and its Application in Bioremediation (pp. 363-380). Springer, Singapore (2021).
- Shukla, B. K. and Goel, A.: Study on oxygen transfer by solid jet aerator with multiple openings. Engineering science and technology, an international journal, 21(2), 255-260 (2018).
- Patil, P. N., Sawant, D. V., and Deshmukh, R. N.: Physico-chemical parameters for testing of water-a review. International journal of environmental sciences, 3(3), 1194 (2012).
- Shukla, B. K., Khan, A., Saikiran, G., and Sriram, M.: Comparative study on effect of variation in opening shape on oxygenation performance of surface jet aerators used in water and wastewater treatment. Journal of Green Engineering, 9(3), 427-440 (2019).
- Adebowale, K. O., Agunbiade, F. O., and Olu-Owolabi, B. I.: Impacts of natural and anthropogenic multiple sources of pollution on the environmental conditions of Ondo State coastal water, Nigeria. Electronic Journal of Environmental, Agriculture and Food Chemistry, 7(4), 2797-2881 (2008).
- Edema, M. O., Omemu, A. M., and Fapetu, O. M.: Microbiology and Physicochemical Analysis of different sources of drinking water in Abeokuta. Nigeria. Nigerian Journal of Microbiology, 15(1), 57-61 (2001).
- Rim-Rukeh, A., Ikhifa, O. G., and Okokoyo, A. P.: Effects of agricultural activities on the water quality of Orogodo River, Agbor Nigeria. J Appl Sci Res, 2(5), 256-259 (2006).
- Shukla, B. K., Goel, A., and Sharma, P. K.: An Experimental Study on Oxygenation Performance of Rectangular Shaped Solid Jet Aerator having Rounded Edges. Journal of Green Engineering, 10, 2728-2745 (2020).
- Dhakyanaika, K., and Kumara, P.: Effects of pollution in River Krishni on hand pump water quality. Journal of Engineering Science & Technology Review, 3(1), 14-22 (2010).
- Rajagopal, T., Thangamani, A., Sevarkodiyone, S. P., Sekar, M., and Archunan, G.: Zooplankton diversity and physico-chemical conditions in three perennial ponds of Virudhunagar district, Tamilnadu. Journal of Environmental Biology, 31(3), 265-272 (2010).
- Eruola, A. O., Ufoegbune, G. C., Eruola, A. O., Awomeso, J. A., Adeofun, C. O., and Idowu, O. A.: An assessment of the effect of industrial pollution on Ibese River, Lagos, Nigeria. African Journal of Environmental Science and Technology, 5(8), 608-61 (2011).
- Shukla, B. K., Rajesh Kumar, V., and Goel, A.: Experimental studies on the effect of variation in jet length on oxygenation performance of elliptical shaped solid jet aerator. Jour of Adv Research in Dynamical & Control Systems, 10(08-special issue), 1037-1044 (2018).
- Koirala, S., Jung, M., Reichstein, M., de Graaf, I. E., Camps‐Valls, G., Ichii, K., Papale, D., Ráduly, B., Schwalm, C.R., Tramontana, G. and Carvalhais, N.: Global distribution of groundwater‐vegetation spatial covariation. Geophysical Research Letters, 44(9), 4134-4142 (2017).
- Agarwal, A., and Saxena, M.: Assessment of pollution by physicochemical water parameters using regression analysis: a case study of Gagan river at Moradabad-India. Advances in Applied Science Research, 2(2), 185-189 (2011).
- Gupta, S., Bhatnagar, M., and Jain, R.: Physico-chemical characteristics and analysis of Fe and Zn in tubewell water and sewage water of Bikaner City. Asian Journal of Chemistry, 15(2), 727 (2003).
- Dan’Azumi, S., and Bichi, M. H.: Industrial pollution and heavy metals profile of Challawa River in Kano, Nigeria. Journal of Applied Sciences in Environmental Sanitation, 5(1), 23-29 (2010).
- Sanap, R. R., Mohite, A. K., Pingle, S. D., and Gunale, V. R.: Evaluation of water qualities of Godawari River with reference to physico-chemical parameters, Dist. Nasik (MS), India. Pollution Research, 25(4), 775 (2006).
- Pande, K. S., and Sharma, S. D.: Natural Purification Capacity for Ramganga River at Moradabad (UP). Pollution Research, 17, 409-415 (1998).
- Murhekar, M. V., Murhekar, K. M., Das, D., Arankalle, V. A., and Sehgal, S. C.: Prevalence of hepatitis B infection among the primitive tribes of Andaman & Nicobar Islands. Indian Journal of Medical Research, 111, 199-203 (2000).
- American Public Health Association. APHA standard methods for the examination of water and wastewater. Standard methods for the examination of water & wastewater. Washington, DC: American Public Health Association (2005).
- Chapman, D.: Water quality assessments: a guide to the use of biota, sediments and water in environmental monitoring. CRC Press (2021).
- Boyd, C. E.: Water quality in warmwater fish ponds. Craftmaster Printers. Inc. Opelika, Alabama (1979).
- Sharma, P. K., Ayub, S., and Shukla, B. K.: Cost and Feasibility Analysis of Chromium Removal from Water Using Agro and Horticultural Wastes as Adsorbents. In 3rd International Conference on Innovative Technologies for Clean and Sustainable Development: ITCSD 2020 3 (pp. 449-463). Springer International Publishing (2021).
- Garg, R. K., Rao, R. J., Uchchariya, D., Shukla, G., and Saksena, D. N.: Seasonal variations in water quality and major threats to Ramsagar reservoir, India. African journal of environmental science and technology, 4(2), 61-76 (2010).
- Van Leeuwen, A., De Roos, A. M., and Persson, L.: How cod shapes its world. Journal of Sea Research, 60(1-2), 89-104 (2008).
- Verma, D. K., Satyaveer, N. K. M., Kumar, P., and Jayaswa, R.: Important Water Quality Parameters in Aquaculture: An Overview. Agriculture and Environment, 3(3), 24-29 (2022).
- Butler, J. N.: Aquatic chemistry: an introduction emphasizing chemical equilibria in natural waters (Stumm, Werner) (1971).
- Lawson, T. B. (Ed.). Fundamentals of aquacultural engineering. Springer Science and Business Media (1994).
- Diana, J. S., Szyper, J. P., Batterson, T. R., Boyd, C. E., and Piedrahita, R. H.: Water quality in ponds. Dynamics of pond aquaculture, 53-71 (2017).
- Siti-Zahrah, A., Padilah, B., Azila, A., Rimatulhana, R., and Shahidan, H.: Multiple streptococcal species infection in cage-cultured red tilapia but showing similar clinical signs. Diseases in Asian Aquaculture VI. Manila: Fish Health Section, Asian Fisheries Society, 2008, 313-320 (2008).
- Eglal, A. O., Nour, A. M., Essa, M. A., Zaki, M. A., and Mabrouk, H. A.: Technical and economical evaluation of small-scale fish cage culture for youth in the River Nile for Egypt: 1. Effect of stocking density of monosex Nile Tilapia (Oreochromisniloticus) fingerlings. In Cage aquaculture in Asia: Proceeding of the International symposium on cage aquaculture in Asia: pp (pp. 107-114) (2009).
- Mondal, M. N., Shahin, J., Wahab, M. A., Asaduzzaman, M., and Yang, Y.: Comparison between cage and pond production of Thai Climbing Perch (Anabas testudineus) and Tilapia (Oreochromis niloticus) under three management systems. Journal of the Bangladesh Agricultural University, 8(2), 313-322 (2010).
- Jiwyam, W.: Extensive net cage culture of Nile Tilapia (Oreochromis niloticus) fingerlings in nutrient-enriched pond. Our Nature, 10(1), 61-70 (2012).
- Nyanti, L., Hii, K. M., Sow, A., Norhadi, I., and Ling, T. Y.: Impacts of aquaculture at different depths and distances from cage culture sites in Batang Ai Hydroelectric Dam Reservoir, Sarawak, Malaysia. World Applied Sciences Journal, 19(4), 451-456 (2012).
- Gorlach-Lira, K., Pacheco, C., Carvalho, L. C. T., Melo Júnior, H. N., and Crispim, M. C.: The influence of fish culture in floating net cages on microbial indicators of water quality. Brazilian Journal of Biology, 73, 457-463 (2013).
- Yee, L. T., Paka, D. D., Nyanti, L., Ismail, N., and Emang, J. J.: Water quality at Batang Ai hydroelectric reservoir (Sarawak, Malaysia) and implications for aquaculture. International Journal of Applied, 2(6), 23-30 (2012).
- Furnas, M. J.: The behavior of nutrients in tropical aquatic ecosystems. In Pollution in tropical aquatic systems (pp. 29-65). CRC Press (2018).
- Manickam, N., Bhavan, P. S., Santhanam, P., Bhuvaneswari, R., Muralisankar, T., Srinivasan, V., Asaikkutti, A., Rajkumar, G., Udayasuriyan, R. and Karthik, M.: Impact of seasonal changes in zooplankton biodiversity in Ukkadam Lake, Coimbatore, Tamil Nadu, India, and potential future implications of climate change. The Journal of Basic and Applied Zoology, 79(1), 1-10 (2018).
- Self, J. R., and Waskom, R. M.: Nitrates in drinking water. Service in action; no. 0.517 (2008).
- Gorde, S. P., and Jadhav, M. V.: Assessment of water quality parameters: a review. J Eng Res Appl, 3(6), 2029-2035 (2013).
- Sawant, R., and Chavan, N.: Water quality status of Mahagaon reservoir from Gadhinglaj Tahsil from Maharashtra. International Journal of Science, Environment and Technology, 2(6), 1196-1204 (2013).
- Ramakrishnaiah, C. R., Sadashivaiah, C., and Ranganna, G.: Assessment of water quality index for the groundwater in Tumkur Taluk, Karnataka State, India. E-Journal of chemistry, 6(2), 523-530 (2009).
- Rao, G. S., and Nageswararao, G.: Assessment of ground water quality using water quality index. Archive of Environmental Sciences, 7(1), 1-5 (2013).
- Manjare, S. A., Vhanalakar, S. A., and Muley, D. V.: Analysis of water quality using physicochemical parameters Tamdalge tank in Kolhapur district, Maharashtra. International journal of advanced biotechnology and research, 1(2), 115-119 (2010).
- Tripathi, P., Kumar, V., Joshi, G., Singh, S. P., Panwar, S., Naithani, S., and Nautiyal, R.: A comparative study on physico-chemical properties of pulp and paper mill effluent. International Journal of Engineering Research and Applications, 3(6), 811-818 (2013).
- Agrawal, N., Choubey, P. M., and Pandey, J. P.: Water quality assessment of Baba Ghat of Bihar River Rewa (MP) India. International Journal of Scientific and Research Publications, 4(10), 306-308 (2014).
- Kaur, B. J., George, M. P., and Mishra, S.: Water quality assessment of river Yamuna in Delhi stretch during Idol immersion. International Journal of Environmental Sciences, 3(6), 2122 (2013).
- Khan, A. A., Shammi, Q. J., Hussain, S. D., and Gulam, N. N.: Seasonal variations in physico-chemical parameters in upper lake of Bhopal (MP). International Journal of Applied and Universal Research, 2(2), 1-7 (2015).
- Altaf, H. G., and Saltanat, P.: Effect of physico-chemical conditions on the structure and composition of the phytoplankton community in Wular Lake at Lankrishipora, Kashmir. International Journal of Biodiversity and Conservation, 6(1), 71-84 (2014).
- Mishra, R., Prajapati, R. K., Dwivedi, V. K., and Mishra, A.: Water quality assessment of Rani Lake of Rewa (MP), India. GERF Bulletin of Biosciences, 2(2), 11-17 (2011).
- Rajurkar, N. S., Nongbri, B., and Patwardhan, A. M.: Physico-chemical and microbial analysis of Umiam (Barapani) lake water. Indian Journal of Environmental Protection, 23, 633-639 (2003).
- Shukla, B. K., Sharma, P. K., and Goel, A.: Study on oxygenation performance of solid jet aerator having circular opening corresponding to variable jet length and flow area. In Journal of Physics: Conference Series (Vol. 1531, No. 1, p. 012117). IOP Publishing (2020).
- Gupta, A. K., Kavita, M., Pramod, K., Chandrasekhar, S., and Sumita, S.: Impact of religious activities on the water characteristics of prominent ponds at Varanasi (UP), India. Plant Archives, 11(1), 297-300 (2011).
- Singh, S., Singh, V. P., Garg, P., and Shukla, B. K.: Physico-Chemical Analysis of Groundwater in Noida-Ghaziabad Region. In IOP Conference Series: Earth and Environmental Science (Vol. 1110, No. 1, p. 012028). IOP Publishing (2023).
- Imtiyaz, I., Krishnakant, Shukla, B. K., Varadharajan, S., and Bharti, G.: A Comprehensive Review of Mass Transfer Phenomenon in Gas-Liquid Phase Flow During Aeration in Wastewater Treatment. In Proceedings of Indian Geotechnical and Geoenvironmental Engineering Conference (IGGEC) 2021, Vol. 2 (pp. 127-135). Singapore: Springer Nature Singapore (2022).